Introduction
In today s data-driven world, businesses need fast, scalable, and cost-effective solutions for analyzing data.
In this project, we built a complete data analytics pipeline using AWS S3, AWS Glue, AWS Athena, and Power BI-Desktop all fully managed cloud services.
With the help of this setup you can easily store , clean query and visualize data without managing any servers.
Prerequisites
Before we dive in, ensure you have:
- AWS Account
- AWS CLI configured
- Install Power BI- Desktop on your local Machine
- Data for analysis
Step 1: Store Data in Amazon S3
- AWS Console → S3 → Create bucket.
- Name:
yourname-sales-data-2025(unique). - Region: choose one near you (e.g., ap-south-1).
- Public access: Keep blocked (default).
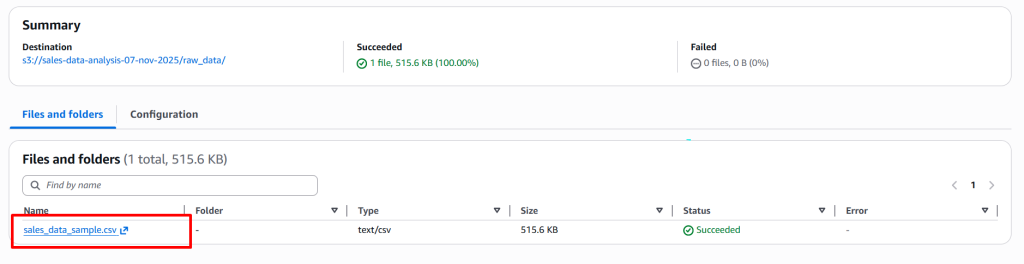
- Inside bucket → Upload → choose
sales_data.csv.
- Name:
- Note S3 path:
s3://yourname-sales-data-2025/sales_data.csv
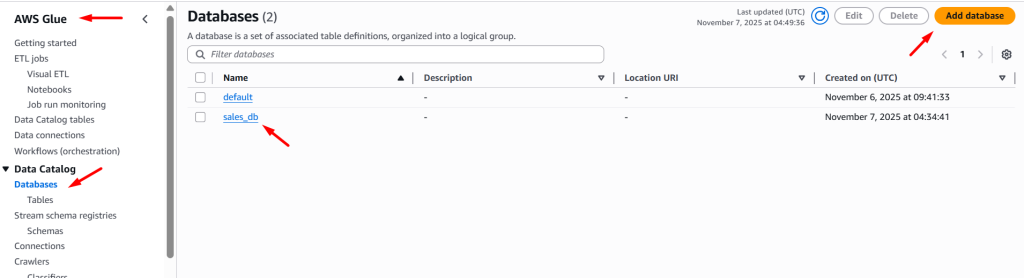
Step 2: Create AWS Glue Crawler and Database
Next, we used AWS Glue to automatically detect the schema of our CSV file.
- Go to AWS Glue → Database → Add database
Now , Create AWS Glue Crawlers
- Go to AWS Glue > crawlers > add crawlers
- Crawler Detail
- Name: your-crawlers-name
- Click on Next button
- Data Source Configuration
- Data sources: Click on add datasource > select S3 > Select your bucket > click add
- Click on Next button
- Configure Security Setting
- IAM role: Create IAM role
- Click on Next button
- Output and Scheduling Configuration
- Target Database : Select yoru database
- Table name : tablename (Optional- If you want give specific name of yoru tabel)
- Crawler Schedule: select On demand or scheduling
- Click on Next button
- Click on Create button
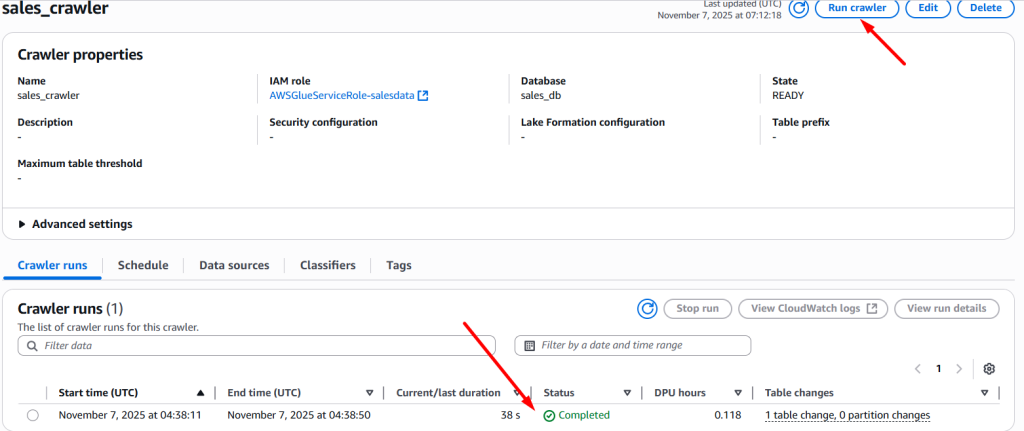
- Crawler Detail
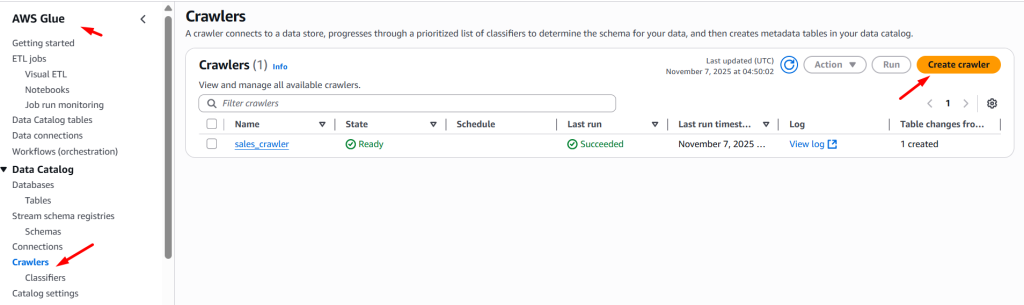
Now Select your crawler name and click on Run crawler
Step 3: Query Data using Amazon Athena
Next, we used AWS athena to verify your dataset.
- Go to AWS Athena → Select Database
- Make sure your database and table name is correct
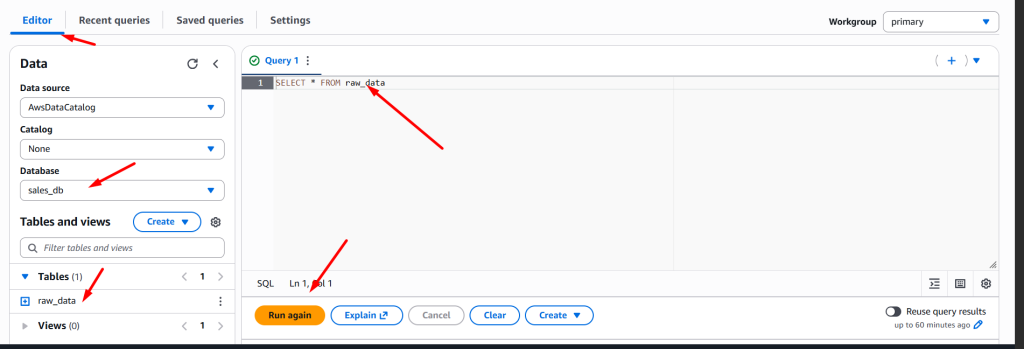
- Now type query in query editor and click in Run Button
SELECT * FROM raw_data
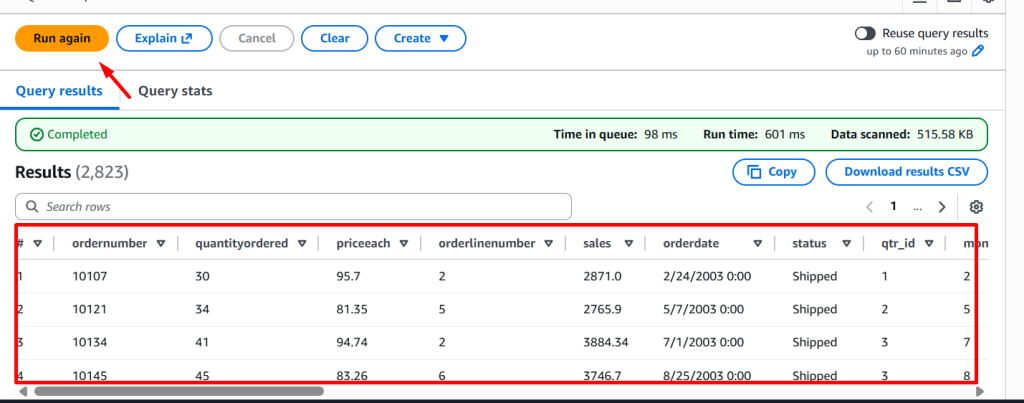
- After succesfully show datasets we have to move to analysis and visualize dashboard using Power BI-Desktop
- Before using power BI make sure you have install on your local machine as well as ODBC driver for connect Amazon Athena
Step 4: To Install and setup Power BI and ODBC Driver
- Download Power Bi-Desktop
- Installation and setup Power BI
- Download ODBC driver
- Installation and setup ODBC
Now Configure ODBC driver to connect Amazon Athena
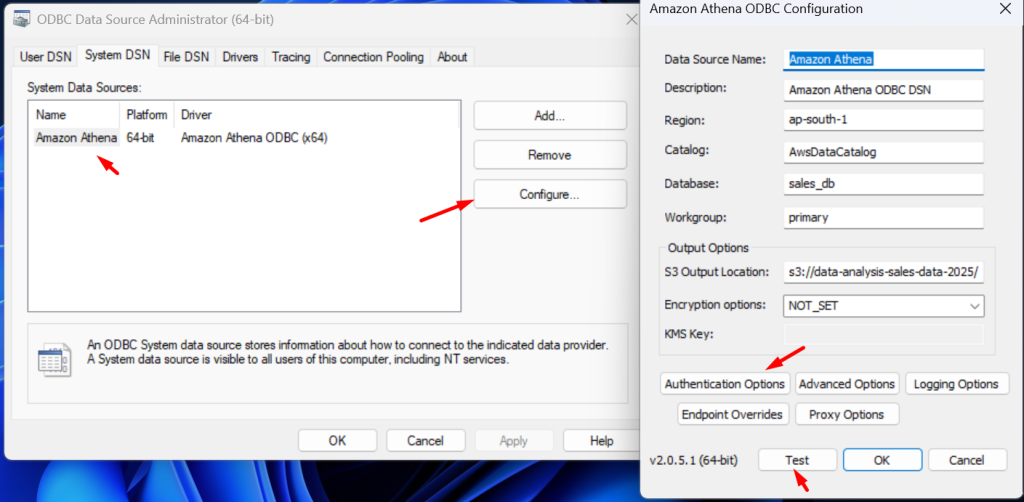
- First open ODBC driver
- Select system DSN and click on configure
- Data Source Name : Amazon Athena
- Region: ap-south-1
- Database: sales_db
- Workgroup: primary [ based on your Athena workgroup]
- S3 output location: s3://your-bucket-name/<folder_name>
- Click on Authentication Option
- Select IAM Credentials
- Provide Access key and Secret key
- Select IAM Credentials
Step 5: Connect Amazon Athena with Power BI
To create interactive dashboards, we connected Athena to Power BI.
You can connect in two ways:
- Using the Amazon Athena ODBC Driver
- Or directly through Get Data → Amazon Athena in Power BI Desktop
Then we signed in with our AWS credentials (Access key, Secret key, and Session token if required).
In this tutorial we are using ODBC driver to conenct.
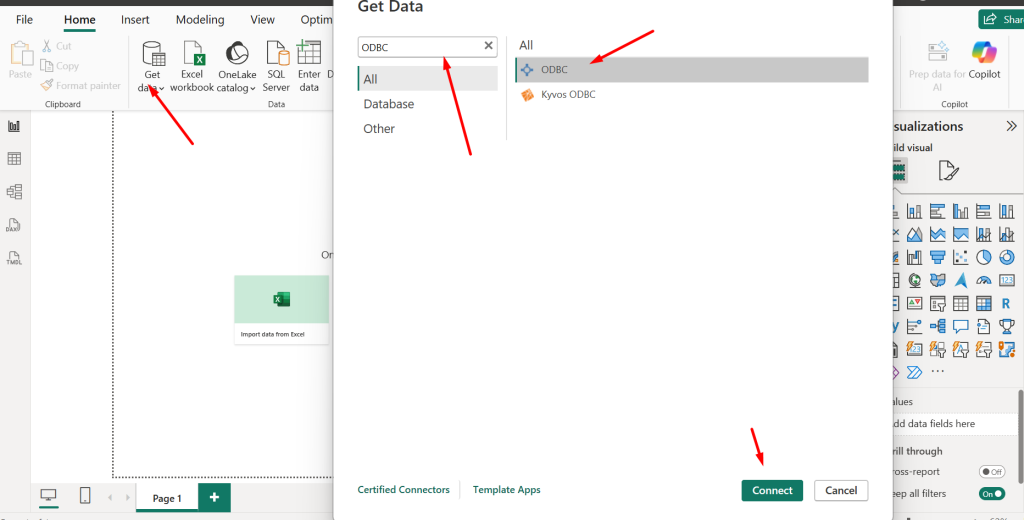
Now open Power BI- Desktop
- Click on Get data on Home tab > click on more option
- In search bar search ODBC > Select ODBC and click on connect
Notes: If your getting error while connect ensure your have enter correct credentials
Step 6: Build Dashboard in Power BI
After all the process are successfully completed now we build dashboard fro analayis and visaulization
- Press Crtl + / on your keyboard
- Type total sales city Pie
Where, Sales is column , city is column and pie is visual type
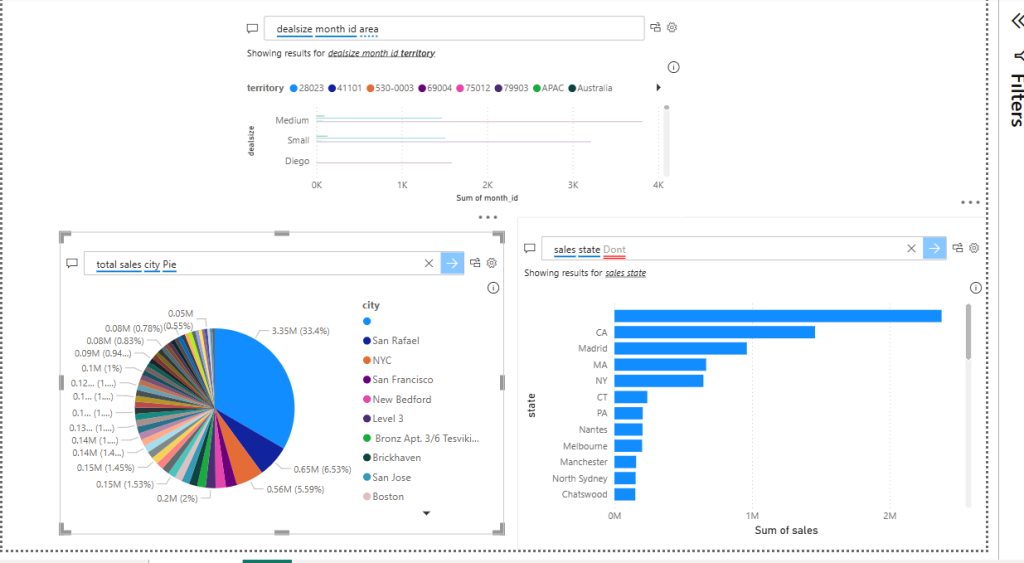
Boom, you have successfully complete full data analysis pipeline using AWS S3 , AWS Glue , AWS Athena and Power BI -Desktop. Now, youo can create multiple chart to analysis according to your requirements.