





Introduction
Building a serverless data lake architecture allows organizations to extract actionable insights from large-scale raw data without the overhead of provisioning relational database clusters or managing ETL servers. By coupling Amazon S3 for durable object storage with AWS Glue for automated schema inference and Amazon Athena for interactive SQL queries, you create a zero-infrastructure data pipeline.
In this guide, we will connect this serverless AWS data architecture directly to Power BI Desktop via ODBC drivers. We will cover S3 bucket prefixing, IAM Glue Service Role policies, Athena query output partitioning, and building continuous analytical visualizations with DirectQuery and DAX measures.
Prerequisites
Before we dive in, ensure you have:
- AWS Account
- AWS CLI configured
- Install Power BI- Desktop on your local Machine
- Data for analysis
Step 1: Provision Amazon S3 Data Lake Bucket and Upload Raw Datasets
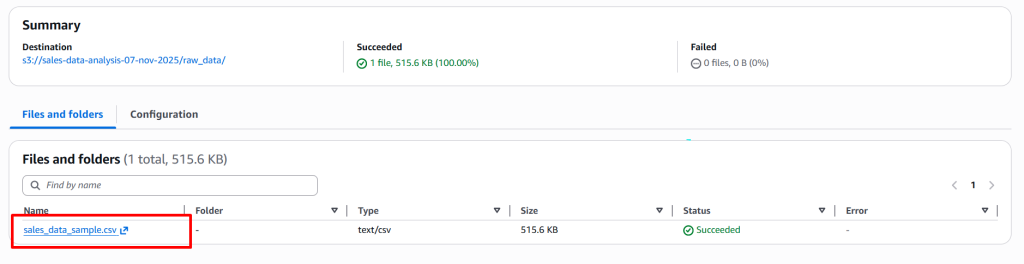
Create an isolated Amazon S3 bucket to serve as your data lake storage layer. Keep all public access settings blocked to ensure enterprise security.
- Navigate to S3 Console > Create Bucket.
- Name your bucket using a globally unique namespace e.g., cloudwithyuvi-sales-datalake-2026
- Select your target AWS region e.g. ap-south-1.
- Create two separate prefix folders inside the bucket:
/raw-data/(Upload your raw sales_data.csv file here)./athena-results/(To store Athena execution queries).
- Note S3 path:
s3://yourname-sales-data-2025/sales_data.csv
Step 2: Configure AWS Glue Data Catalog Database & Crawler
AWS Glue infers structural schemas from raw CSV files and populates the unified AWS Glue Data Catalog.
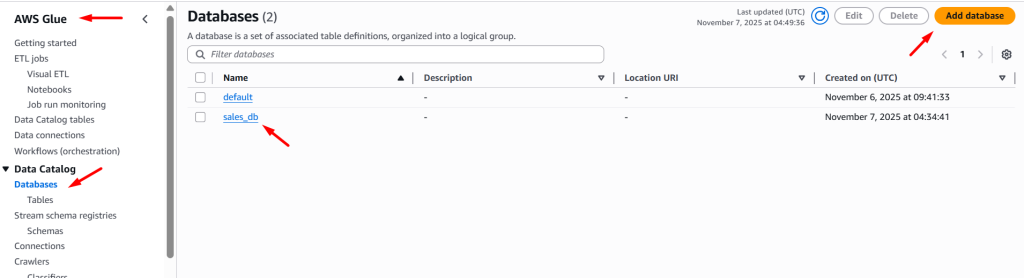
- Open AWS Glue > Data Catalog > Databases and click Add database (e.g.,
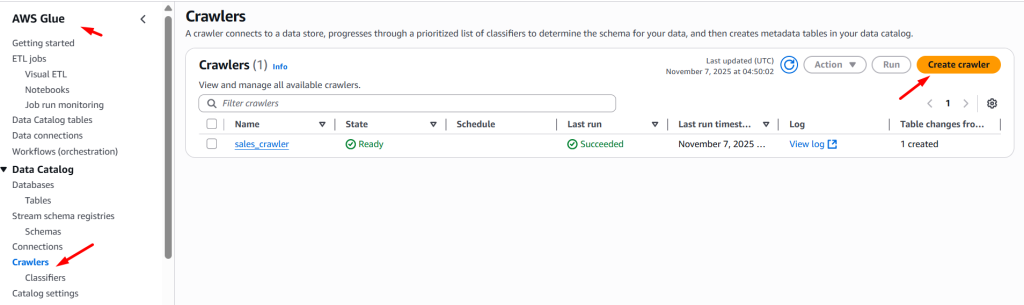
sales_db). - Go to Crawlers -> Create Crawler and set the path pointing to
s3://cloudwithyuvi-sales-datalake-2026/raw-data/. - Attach an IAM Role with the
AWSGlueServiceRolemanaged policy attached alongside an inline S3 read policy:
{
  "Version": "2012-10-17",
  "Statement": [
    {
      "Effect": "Allow",
      "Action": ["s3:GetObject", "s3:ListBucket"],
      "Resource": [
        "arn:aws:s3:::cloudwithyuvi-sales-datalake-2026",
        "arn:aws:s3:::cloudwithyuvi-sales-datalake-2026/*"
      ]
    }
  ]
}
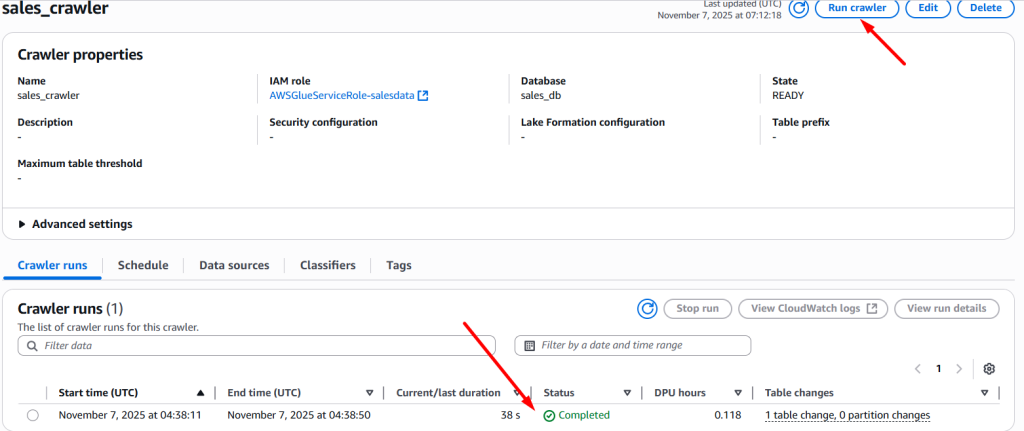
- Run the crawler. Once completed, verify that the table metadata schema is registered inside your
sales_dbdatabase.
- Now Select your crawler name and click on Run crawler
Step 3: Validate Schema & Output Bucket Settings in Amazon Athena
Before connecting business intelligence tools, configure Amazon Athena to write query results to your dedicated S3 output bucket.
- Open Amazon Athena > Settings > Manage.
- Set the Location of query result path to
s3://cloudwithyuvi-sales-datalake-2026/athena-results/. - In the Athena Query Editor, select
sales_dbfrom the Database dropdown and execute a test validation query:
SELECT city, SUM(sales) AS total_revenue
FROM sales_data
GROUP BY city
ORDER BY total_revenue DESC
LIMIT 10;
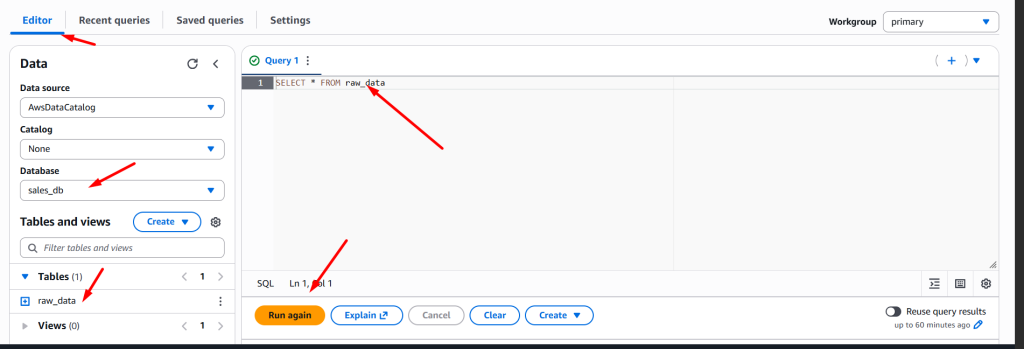
- Now type query in query editor and click in Run Button
- SELECT * FROM raw_data
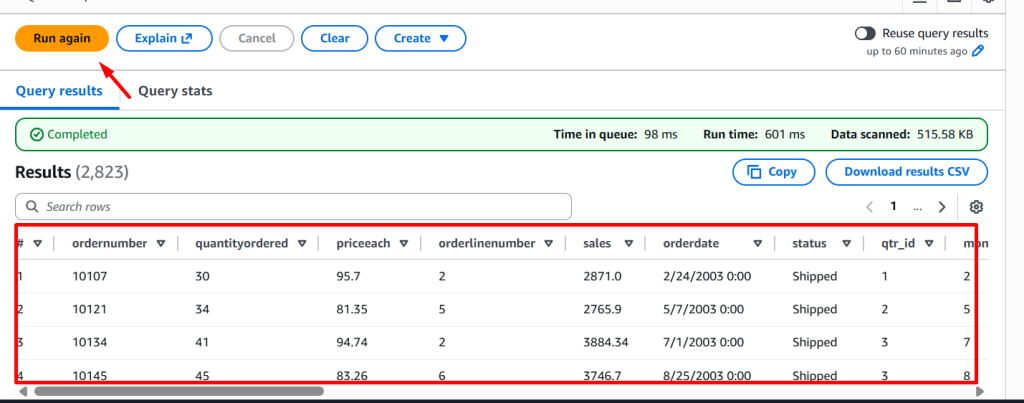
Step 4: Install and Configure the Amazon Athena ODBC Driver
- Download Power Bi-Desktop
- Installation and setup Power BI
- Download ODBC driver
- Installation and setup ODBC
To allow Power BI Desktop to communicate with AWS query engines, install the official Simba Amazon Athena ODBC Driver on your local workstation.
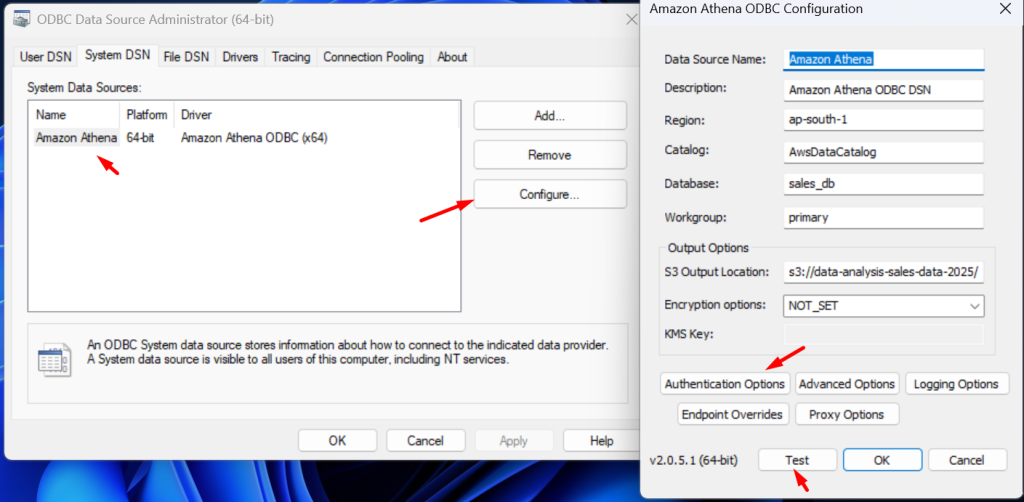
- Open ODBC Data Source Administrator (64-bit) in Windows.
- Under System DSN, click Add and select Simba Athena ODBC Driver.
- Configure the DSN Parameters:
- Data Source Name:
Amazon Athena DSN - AwsRegion:
ap-south-1 - Catalog:
AwsDataCatalog - Database:
sales_db - S3 Output Location:
s3://cloudwithyuvi-sales-datalake-2026/athena-results/ - Authentication Type: Select
IAM Credentialsand enter your dedicated AWS Access Key and Secret Access Key.
Step 5: Import Data into Power BI Desktop & Build Visuals
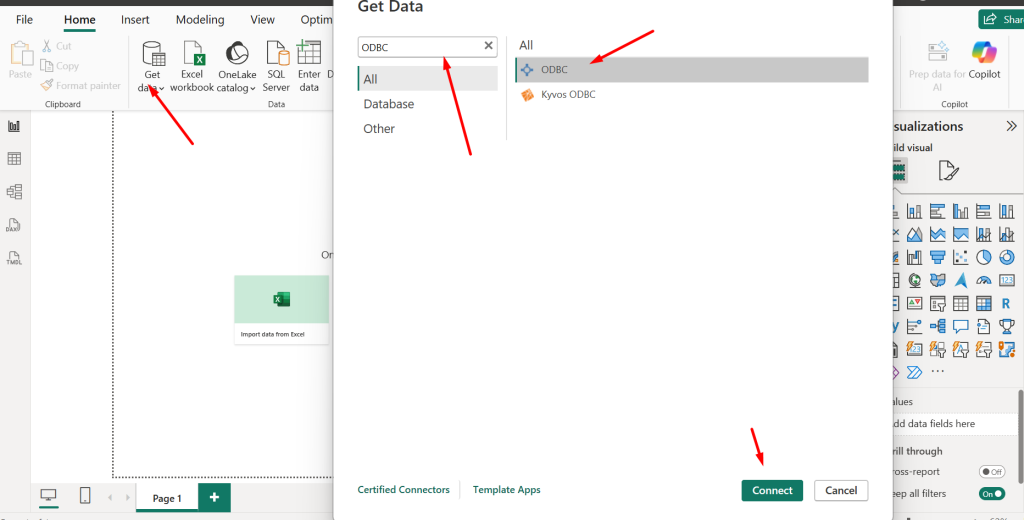
- Launch Power BI Desktop, navigate to Get Data -> More -> ODBC, and select your
Amazon Athena DSN. - Select DirectQuery mode to keep report queries live against AWS Athena (or select Import for smaller cached reporting).
- Create custom measures using DAX for analytical reporting:
Total Sales = SUM(sales_data[sales])
- Drag the City column into a Pie Chart or Bar Chart visual axis and map the
Total SalesDAX measure to the values field to visualize regional sales performance.
Step 6: Build Dashboard in Power BI
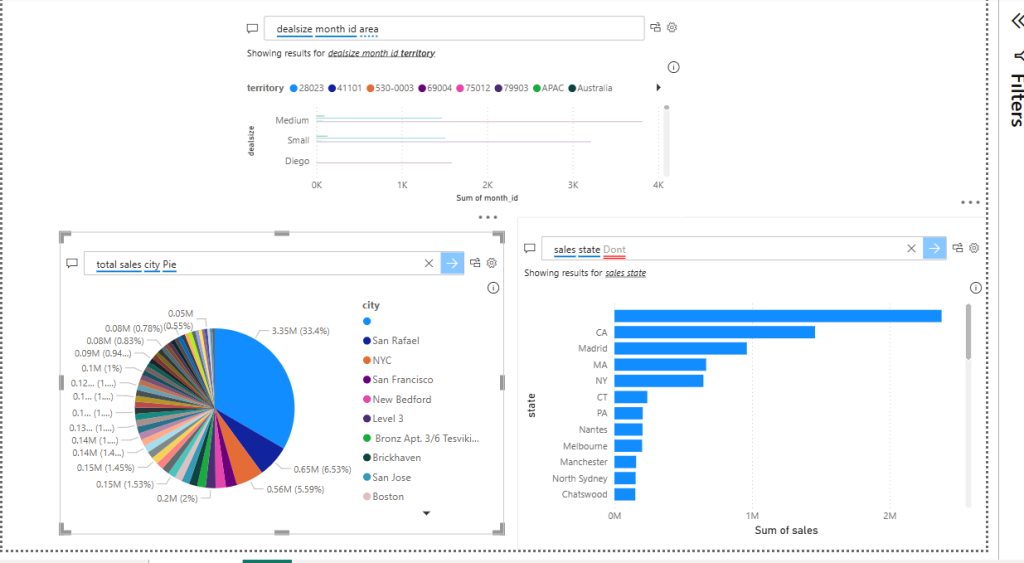
After all the process are successfully completed now we build dashboard fro analayis and visaulization
- Press Crtl + / on your keyboard
- Type total sales city Pie
Where, Sales is column , city is column and pie is visual type
Production Architecture Security Notice
Enterprise Analytics & Cost Management Warnings:
- Athena Scanning Cost Optimization: Amazon Athena charges $5.00 per TB of data scanned. Querying uncompressed CSV files forces Athena to scan the entire object for every Power BI refresh. For production data lakes, always use AWS Glue ETL jobs to convert raw CSV data into Apache Parquet columnar format with Snappy compression to reduce query scan costs by up to 90%.
- IAM Access Key Management: Never assign your primary AWS Account Root Access Keys to local Power BI ODBC DSN configurations. Create an isolated IAM user with minimum permissions scoped strictly to
AmazonAthenaFullAccessand read access to your specific S3 data lake buckets.
Production Troubleshooting: Common AWS Data Lake & Power BI Errors
Connecting cloud query engines to desktop analytics software can trigger authentication drops or schema mismatch locks. Use the diagnostic matrix below to resolve issues fast:
Error 1: Athena Query Output Location Not Specified
- The Error Log:
Query failed: No output location provided. An output location is required to store query results in Amazon S3 (Service: AmazonAthena, Status Code: 400).
- The Root Cause: Amazon Athena requires an explicit S3 URI path to dump temporary query CSV result files before returning results to Power BI.
- The Fix: Navigate to the Amazon Athena Console -> Workgroups -> primary. Click Edit and set the Query result location field to
s3://your-bucket-name/athena-results/. Ensure the location ends with a trailing forward slash/.
Error 2: Power BI ODBC Connection Timeout / Access Denied
- The Error Log:
ODBC: ERROR [HY000] [Simba][Athena] (1040) An error has occurred during authentication: Access Denied. Check your credentials.
- The Root Cause: The IAM User credentials supplied inside the ODBC driver setup lack sufficient permissions to read from the AWS Glue Data Catalog or access S3 buckets.
- The Fix: Open the IAM Console -> Users, select the user bound to Power BI, and ensure both of the following managed policies are attached:
AmazonAthenaFullAccessAWSGlueConsoleFullAccess(or custom Glue catalog policy)
Error 3: Glue Crawler Fails to Infer CSV Schema Columns
- The Error Log: Running the Glue Crawler results in a table where all column headers are labeled generically as
col0,col1,col2instead of actual header names. - The Root Cause: The uploaded CSV file lacks proper header formatting, or the Glue Crawler classification parameters failed to detect header rows.
- The Fix: Open your AWS Glue Crawler settings, scroll down to Configuration options, and select Update the table definition in the data catalog. Under schema edit preferences, explicitly check the option “First row of line contains column names”.

